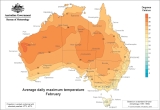
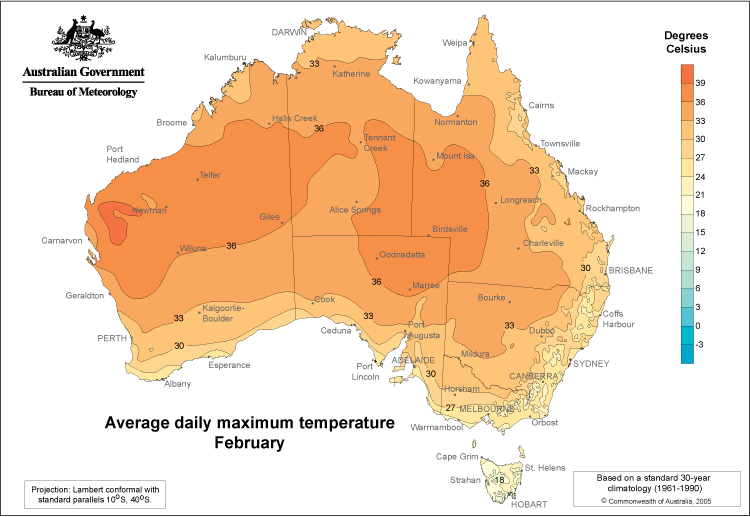
Average daily Maximum Temperature - February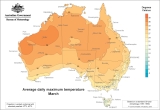
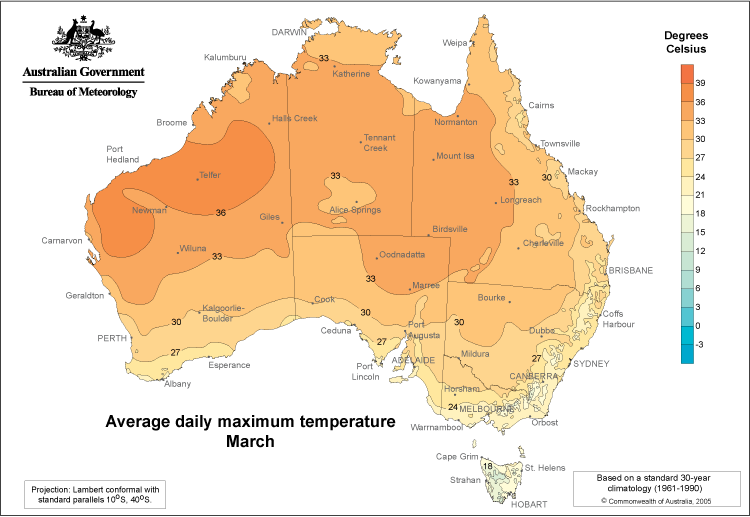
Average daily Maximum Temperature - March
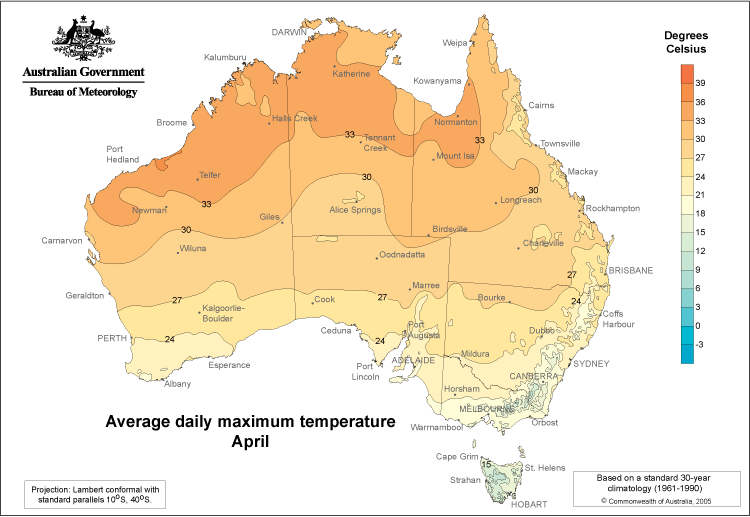
Average daily Maximum Temperature - April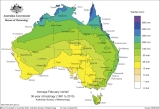
Average Rainfall - February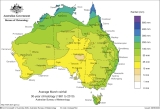
Average Rainfall - March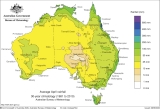
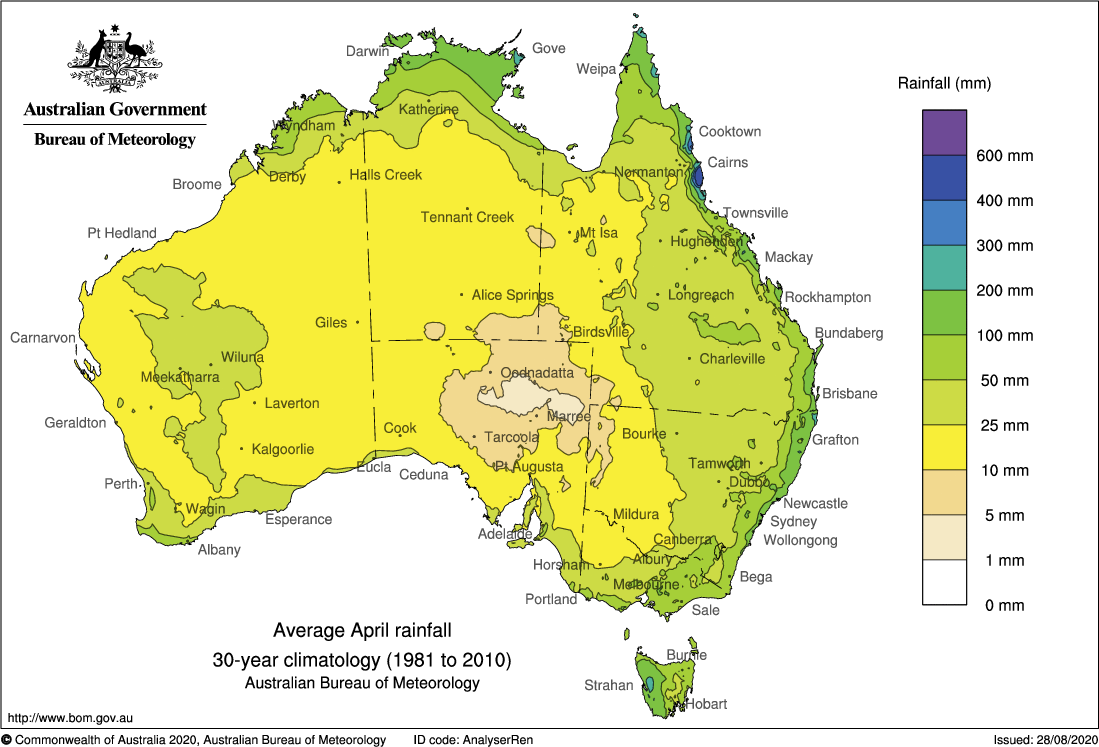
Average Rainfall - April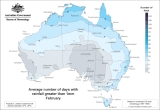
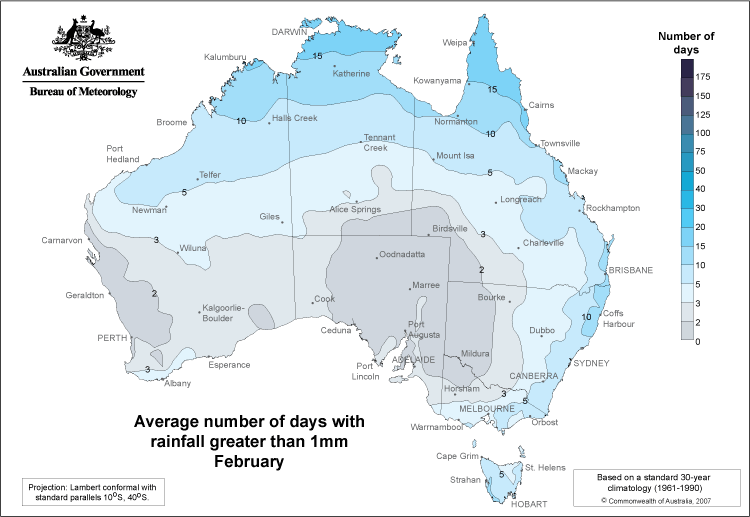
Average number of dayswith rainfall greater than 1mm - February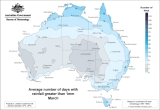
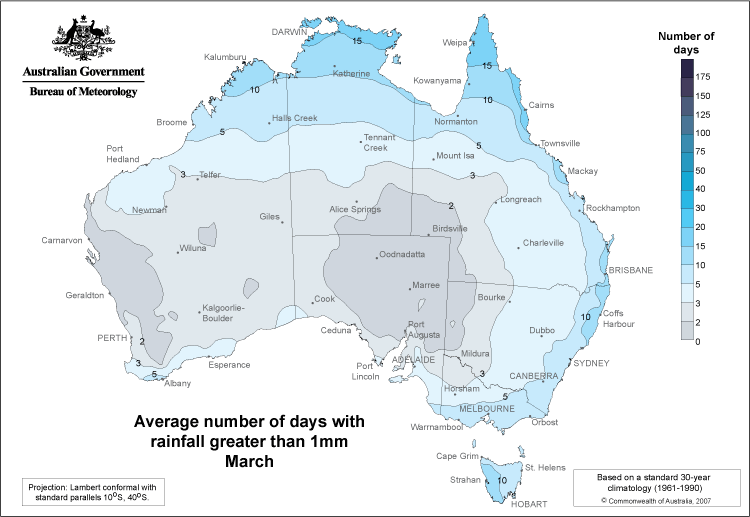
Average number of dayswith rainfall greater than 1mm - March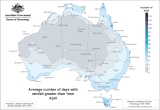
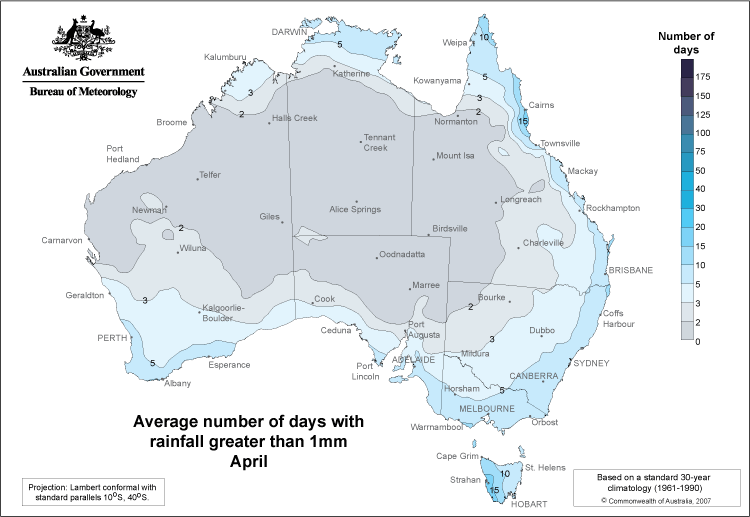
Average number of dayswith rainfall greater than 1mm - April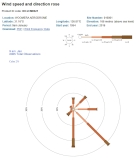
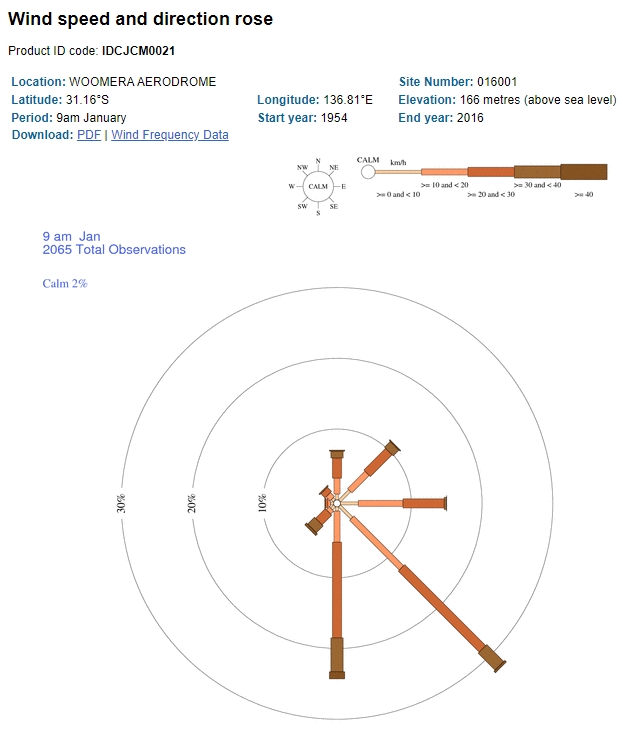
Wind speed and direction rose - Woomera 9:00am January
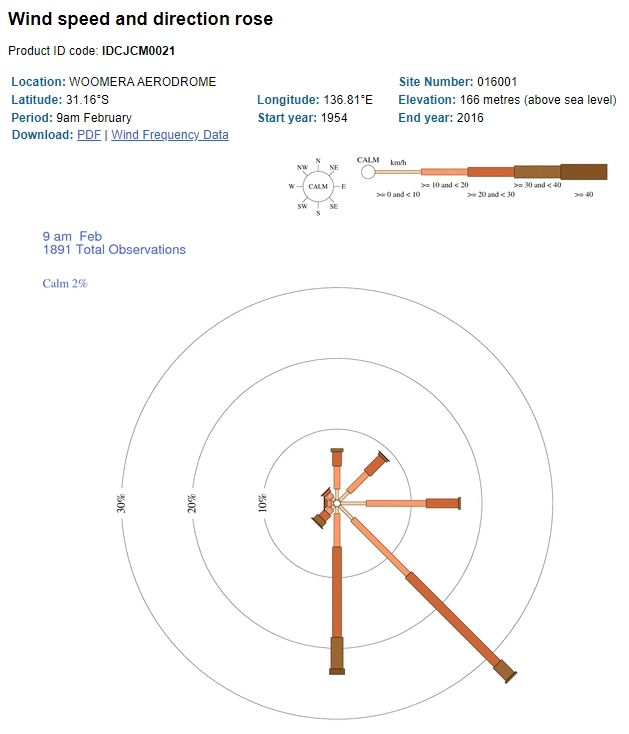
Wind speed and direction rose - Woomera 9:00am February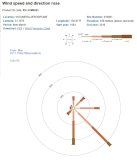
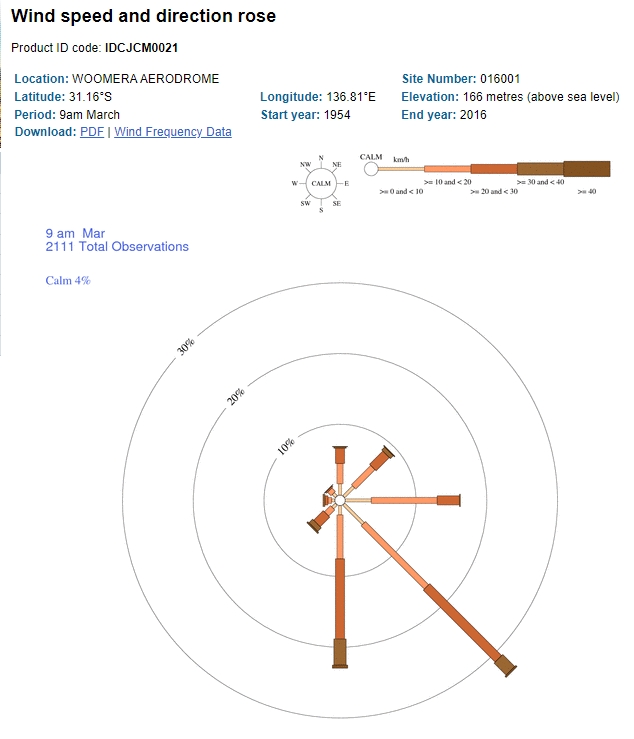
Wind speed and direction rose - Woomera 9:00am March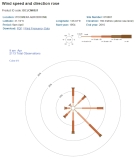
Wind speed and direction rose - Woomera 3:00pm April
Climate
Summary from BoM statistics pages for closest 2 weather station to Lake Gairdner (Woomera and Nonning).
Lowest wind speeds - 1. May, 2. June, 3. April, 4. July
Lowest rain - 1. March, 2. April, 3. Feburary, 4. November
Highest rain - 1. June, 2. July, 3. August, 4. September
Highest temps - 1.Janurary 2.feburary 3. December 4. March
Lowest temps - 1. June, 2. July, 3. August, 4. May
Most clear days - 1. March, 2. Janurary, 3. Feburary, 4. December
Images


Climate Links
- Climate statistics for Nonning
- Climate statistics for Wommera
- 124 years of Australian rainfall
- Decadal and multi-decadal rainfall averages maps
- Wind Roses for Selected Locations in Australia
- Australian Bureau of Metorology
Reference Material
- Airports
- Biology
- Climate
- Geography
- Geological
- Government
- History
- Lunar
- Mining
- Native Title
- Salt Lakes of Australia
- Salt / Dry Lakes of the World
- Glossary